
This guide provides a straightforward method to analyze call behavior patterns, helping users understand incoming call trends over specific time frames. By utilizing features like heat maps and volume graphs, it enables users to visualize data effectively, facilitating informed decision-making. It’s an essential resource for anyone looking to optimize their communication strategies based on detailed insights.
1. Click on the “phone” icon on the left side of the screen.
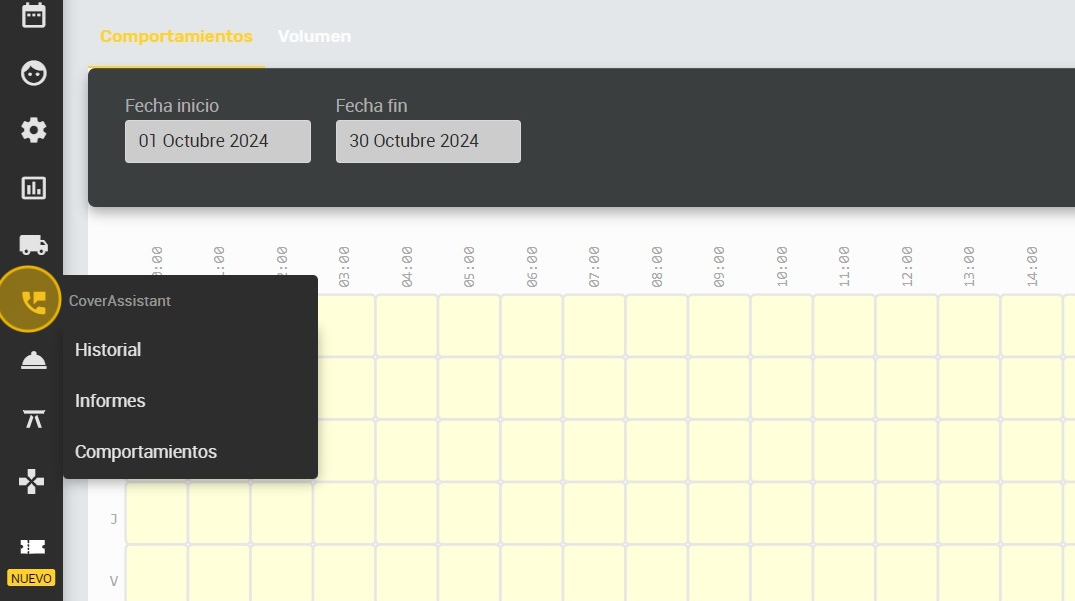
2. Click on “Behaviors”.
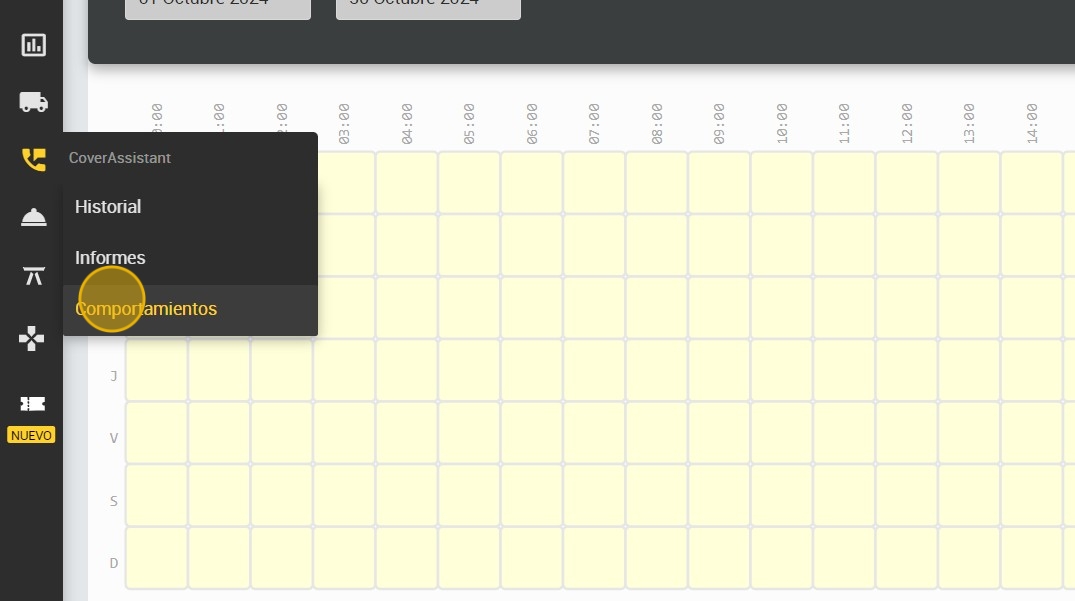
3. Click on “Behaviors”

4. Select the start date and end date.
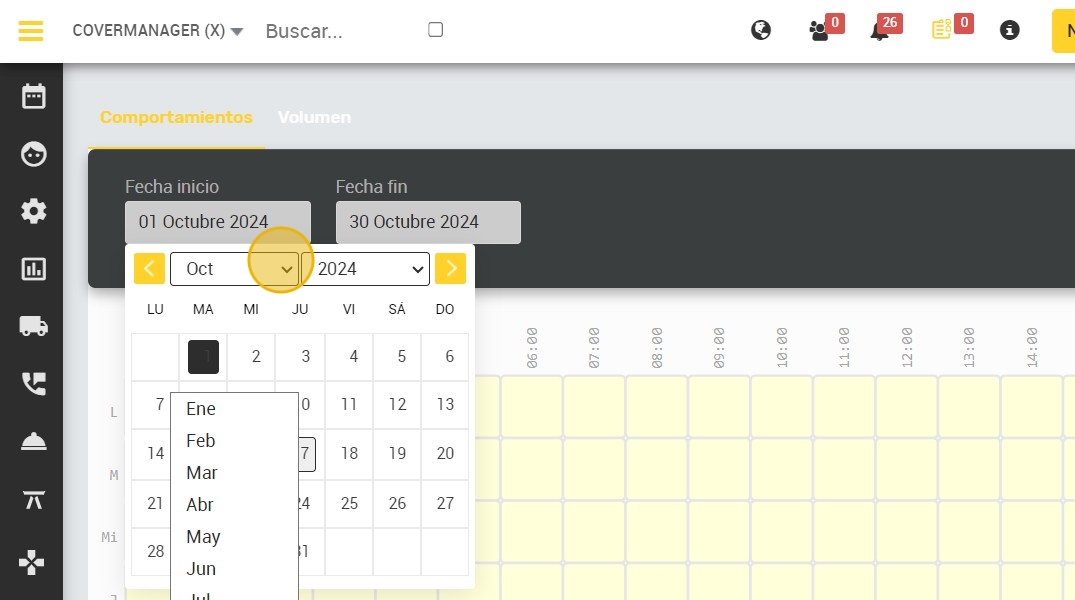
5. When accessing we see a heat map of incoming call behavior relating days of the week/time in a monthly range.

6. Click “Volume” to see the number of calls/day for the month.

7. Select a month.
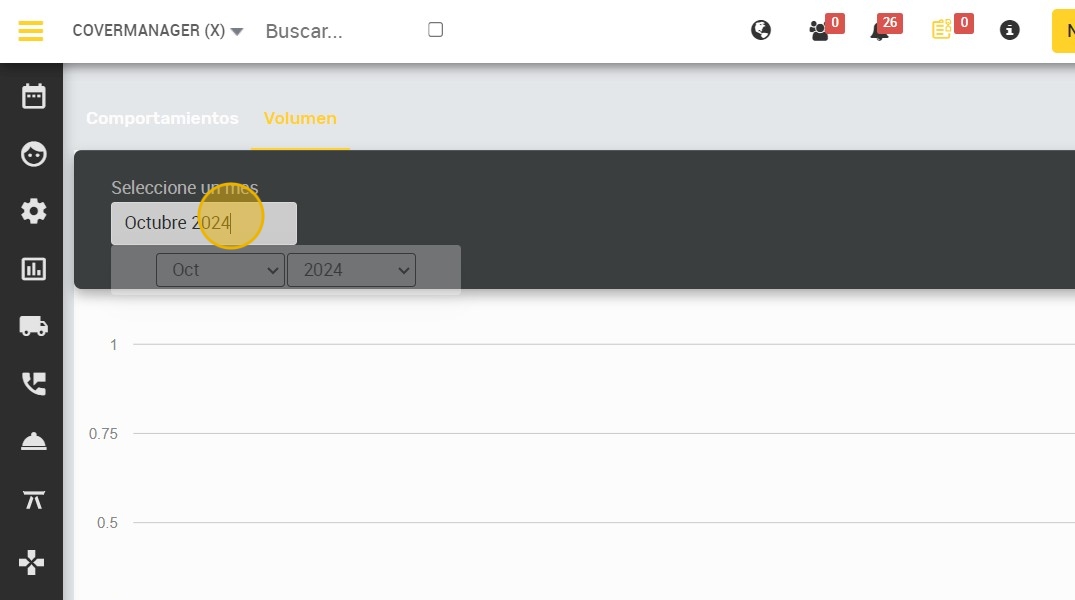
8. Here you can see the volume graph.
